2026 Top Battery Storage Systems for Global Buyers?
Choosing the right Battery Storage System in 2026 requires more than comparing advertised capacity. Global buyers must examine safety, performance, service support, and long-term value. A compact home unit may suit a small apartment, while a commercial facility may need modular cabinets, advanced controls, and scalable power output.
This guide introduces leading battery storage options for residential, commercial, and industrial applications worldwide. It considers lithium iron phosphate chemistry, usable capacity, round-trip efficiency, cycle life, thermal management, and inverter compatibility. Installation conditions matter too. A system performing well in a cool warehouse may behave differently in a humid coastal region.
Real sites reveal more.
Warranty terms, monitoring software, replacement procedures, and installer training often influence ownership costs more than the initial price. Buyers should also verify regional certifications, grid requirements, and manufacturer service networks before placing an order. These details can prevent expensive delays and unsafe installation decisions.
No ranking is perfect. Product specifications may change, and field performance depends on climate, charging habits, maintenance, and system design. Some manufacturers provide limited operating data, which makes direct comparisons difficult. That uncertainty deserves attention, not marketing language.
The following overview evaluates promising 2026 Battery Storage System choices through a practical, evidence-focused lens. It aims to help buyers ask better questions, compare realistic use cases, and identify solutions that remain dependable after installation. A strong purchase is not always the largest or cheapest system. It is the one that fits the site, local requirements, energy goals, and available technical support.
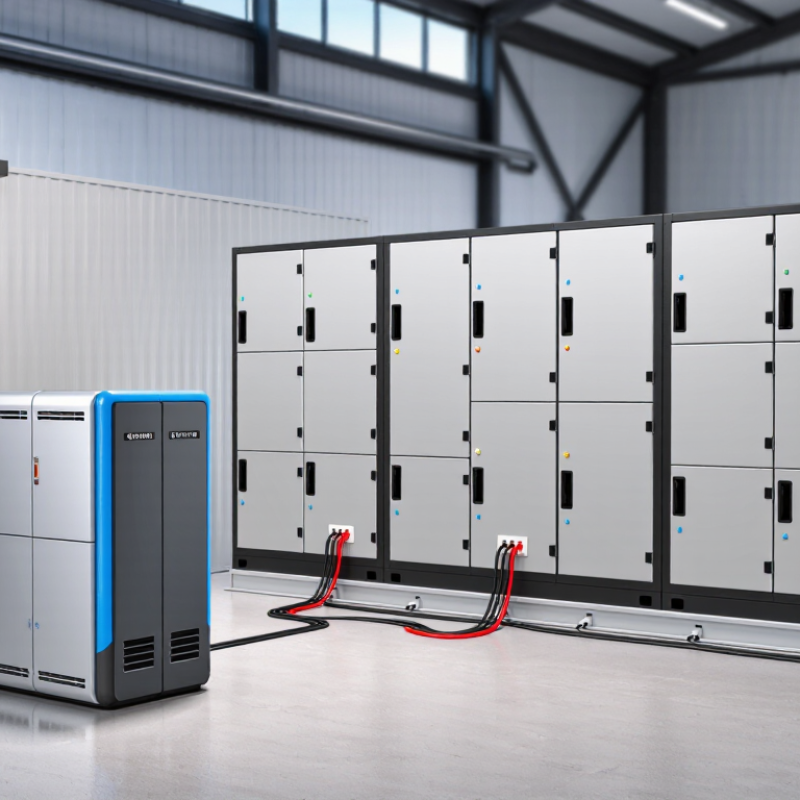
Battery Storage Market in 2026: Global Demand, 4-Hour Systems, and 63 GW Growth
Battery storage is moving from a short-duration balancing tool toward core grid infrastructure. Industry forecasts project about 63 GW of new battery capacity in 2026, driven by renewable integration, peak demand, and transmission constraints. The International Energy Agency reported nearly 42 GW of battery storage additions in 2023, almost twice the previous year’s level.
Four-hour systems are becoming a practical reference for global buyers. They can charge during midday solar peaks and discharge through evening demand, often covering one daily cycle. The U.S. Energy Information Administration has tracked the rapid expansion of utility-scale battery projects, while Lazard’s 2024 Levelized Cost of Storage analysis shows that duration, cycling, and financing strongly affect project economics. Capacity alone is not enough. Round-trip efficiency, degradation rates, thermal management, and warranty conditions deserve equal attention.
Physical details matter. A four-hour container may sit beside a substation, facing heat, dust, humidity, and repeated temperature changes. Buyers should request site-specific performance data, not only laboratory figures. Forecasts remain imperfect. The 63 GW estimate may shift with interest rates, grid approvals, and mineral prices. That uncertainty is easy to underestimate. In some markets, a two-hour system may earn more through frequency services, while a six-hour design could better support evening peaks. Independent testing and transparent operating assumptions remain essential.
Sizing a Battery System: Capacity, 0.5C Power, and 4–8 Hours of Duration
For global buyers, battery sizing starts with the load profile, not the cabinet count. A 2 MW facility needing six hours requires 12 MWh of delivered energy. That figure excludes conversion losses, reserve capacity, and aging. If only 80% of the installed energy is usable, the project may need about 15 MWh before additional design margins. The neatest estimate is often wrong.
A 0.5C system can usually discharge at half its rated energy capacity. A 10 MWh battery, therefore, may deliver 5 MW under suitable conditions. At that output, its theoretical duration is two hours, not four. For six hours at 5 MW, the system needs roughly 30 MWh. A four-to-eight-hour application commonly operates between 0.25C and 0.125C. Buyers should confirm whether the quoted C-rate applies continuously, at a specific temperature, or only at the beginning of life.
Real projects need more than arithmetic. Check usable energy at the end of the warranty, auxiliary consumption, site temperature, and emergency reserve requirements. Request independent test records for capacity, efficiency, thermal behavior, and power response. I have seen designs pass spreadsheet checks but struggle during cold mornings. That weakness deserves attention. Grid connection rules also differ by country, so protection settings and local certification should be reviewed before procurement. A practical model should test weekday peaks, seasonal demand, outages, and future load growth. Personally, I would rather carry a transparent margin than hide uncertainty inside an impressive capacity figure.
Safety and Compliance: NFPA 855, UL 9540A, and 6,000+ Cycle Designs
For global buyers, battery storage safety begins with evidence, not attractive cycle-life claims. NFPA 855 guides installation practices for stationary energy storage systems, including spacing, ventilation, fire protection, and emergency planning. UL 9540A evaluates thermal runaway and fire propagation behavior through structured testing. These standards answer different questions. One addresses system installation. The other examines failure consequences.
A 6,000-cycle design sounds impressive, but operating conditions matter. Temperature, depth of discharge, charging speed, and maintenance can reduce actual service life. Request test reports, degradation curves, and warranty assumptions before comparing bids. A reliable supplier should explain how cells, battery management software, enclosures, and fire controls work together. During technical reviews, small details matter, such as sensor placement and access for emergency responders. Some specifications remain unclear. That uncertainty deserves written clarification.
Tips: Ask for the complete UL 9540A report, not only a certificate summary. Confirm whether NFPA 855 requirements match local fire codes and authority approvals. Check cycle testing at the stated temperature and operating window. Require a clear response plan for alarms, isolation, and damaged modules. Visit a reference installation when possible. Paper compliance is useful, but field conditions can be less tidy.
2026 Top Battery Storage Systems for Global Buyers
Safety and compliance focus: NFPA 855, UL 9540A, and long-life battery designs
How to read this chart: The figures show representative lower-end cycle-life benchmarks commonly associated with major stationary-storage chemistries under controlled operating conditions. Actual results vary with temperature, depth of discharge, charging profile, warranty limits, and system design. NFPA 855 provides installation and fire-safety requirements, while UL 9540A evaluates thermal-runaway fire and explosion characteristics; neither standard guarantees a specific cycle life.
Global Buyer Checklist: Warranty, Degradation, LCOS, and 10–20-Year Value
2026 Top Battery Storage Systems for Global Buyers?
Global Buyer Checklist: Warranty, Degradation, LCOS, and 10–20-Year Value
Battery storage demand is accelerating. The IEA reported about 42 GW of new utility-scale battery capacity in 2023, up roughly 130% year on year. BloombergNEF also recorded a 2024 average battery pack price of 115 dollars per kWh. Lower prices help, but the purchase decision needs deeper testing. Ask for warranty capacity at year 10, not only year one. Check cycle limits, calendar limits, operating temperature, and response-time exclusions. A five-year warranty may look inexpensive today. It can create expensive replacement risk later.
Degradation changes the real economics. Request annual capacity curves, including usable energy after 10 and 15 years. Review augmentation assumptions, replacement labor, inverter life, and recycling costs. LCOS must include these items, plus financing, insurance, land, and grid charges. A low quoted LCOS can still mislead. Lazard’s LCOS reports show wide cost ranges for four-hour battery projects, depending on utilization and assumptions. Compare the same duration, cycling frequency, and discount rate. Otherwise, the numbers are not truly comparable.
Tips: Put every promise in the contract. Require test data from independent laboratories. Link payments to delivered capacity and availability. Check whether the warranty covers energy throughput, not just elapsed years. Model weak cases too: lower cycling, hotter climates, delayed grid connection, and one major component replacement. Ten-year value may look attractive. Twenty-year value demands honest maintenance assumptions.
2026 Top Battery Storage Systems for Global Buyers? - Global Buyer Checklist: Warranty, Degradation, LCOS, and 10–20-Year Value
| System Type | Typical Use Case | Typical Duration | Round-Trip Efficiency | Cycle-Life Range | Warranty Term | Capacity Retention at Warranty End | Indicative Degradation | Indicative LCOS | Expected Economic Life | Buyer Value Assessment |
| Utility-Scale LFP Container | Solar shifting, wind integration, ancillary services and capacity support | 2–4 hours | 85–92% | 6,000–10,000 cycles | 10–15 years | 70–80% | Approximately 2% in year 1, then 1.5–2.5% per year | USD 70–140/MWh | 12–20 years | Strong all-round value where safety, supply scale and frequent cycling are priorities. |
| Long-Duration LFP System | Multi-hour renewable shifting, evening peak coverage and grid balancing | 6–8 hours | 82–90% | 5,000–9,000 cycles | 10–15 years | 70–80% | Approximately 2–3% in year 1, then 1.5–2.5% per year | USD 80–155/MWh | 12–20 years | Good value for renewable-heavy sites, although the larger energy block increases upfront capital. |
| Commercial & Industrial LFP Cabinet | Demand-charge reduction, backup power, solar self-consumption and time-of-use arbitrage | 2–4 hours | 86–94% | 5,000–8,000 cycles | 8–12 years | 70–80% | Approximately 2–3% in year 1, then 1.5–3% per year | USD 90–180/MWh | 10–15 years | Attractive when electricity tariffs, demand charges or backup requirements are sufficiently high. |
| Residential LFP Battery | Solar self-consumption, household backup and limited time-of-use shifting | 2–6 hours | 88–95% | 4,000–8,000 cycles | 10 years | 70–80% | Approximately 2–3% in year 1, then 2–3% per year | USD 140–280/MWh | 10–15 years | Useful for resilience and self-consumption, but installed cost and low utilization can increase LCOS. |
| High-Power LFP System | Fast frequency response, short-duration peak shaving and high-power industrial loads | 0.5–2 hours | 83–91% | 8,000–15,000 cycles | 10–15 years | 70–80% | Approximately 1.5–2.5% in year 1, then 1–2% per year | USD 90–190/MWh | 12–20 years | Best suited to high cycling and power-driven revenue streams rather than long energy discharge. |
| Flow Battery | Long-duration storage, renewable firming and projects requiring many daily cycles | 6–12+ hours | 65–85% | 10,000–20,000+ cycles | 10–20 years | Typically 75–90% | Generally low annual capacity fade; stack replacement may be required over the project life | USD 100–220/MWh | 15–25 years | Potentially strong 20-year value for frequent long-duration cycling, subject to lower efficiency and project-specific financing. |
| High-Cycle LTO System | Very frequent cycling, rapid charging, transport hubs and power-quality applications | 0.25–2 hours | 88–95% | 15,000–30,000+ cycles | 10–15 years | 75–85% | Approximately 1–2% per year under controlled operating conditions | USD 180–350/MWh | 15–25 years | Long life and high safety can justify the premium only when the system is cycled very intensively. |
Global Buyer Checklist and Benchmark Notes
- The figures are indicative 2026 market benchmarks for technology categories, not company-specific product claims. Actual results depend on project size, climate, operating profile, financing, installation cost, and local regulations.
- Require the warranty to state both calendar years and energy throughput or equivalent full cycles, together with minimum usable capacity, round-trip efficiency, availability and response-time guarantees.
- Ask suppliers to provide a degradation model showing year-one fade, annual fade thereafter, temperature assumptions, depth of discharge, state-of-charge limits and augmentation requirements.
- LCOS ranges are indicative delivered-energy costs in USD/MWh over the system life, including assumed capital cost, balance of system, replacement, operations and maintenance, efficiency losses and degradation; they exclude revenue from electricity markets.
- For international procurement, verify IEC 62619, IEC 63056, UL 9540/9540A or equivalent applicable standards, UN 38.3 transport compliance, fire-protection design, cybersecurity, spare-parts availability and local service capability.
- For a 10–20-year value assessment, compare total cost of ownership, expected usable MWh, augmentation cost, end-of-life value, recycling obligations, import duties, insurance and the supplier’s long-term service capacity—not only the initial battery price.